WordPress / Advanced Custom Fields Optimization
Advanced Custom Fields is one of the best plugins for WordPress. With ACF PRO and its repeater/flexible fields you can turn WordPress into powerful CMS.
I always knew that many repeaters, flexible fields or many fields in general, may slow down a website. And performance is very important for me. But it’s not only ACF that should be considered when we talk about performance or optimization. If you have LOTS of plugins they will also have an impact on speed of your website. Serving many JS and CSS that aren’t minified also will slow down your site. By only combining JS/CSS you will see HUGE improvement in loading times (tested multiple times).
Some would shout “CACHE! CACHE!”. Fine, but cache is just one solution of a problem, and it should be used at the very end. Like the cherry on top of the cake ;o)
So, if your website takes a bit of time to load and you heavily use Advanced Custom Fields, then read this little case study to find some optimisation ideas. Even if you don’t use ACF, there will be some tips for you.
Starting Point
When developing a new theme for AIO collective I noticed some major decrease in performance on subpage that have lots of flexible layouts and repeaters inside. I used Query Monitor plugin to pinpoint where was the problem. I always use this plugin for debugging and I highly recommend it if you have some issues with WordPress. There is an option to set a cookie which allows you to monitor frontend when you are logged out from WordPress. Performance will be different for logged in / logged out user so this is very handy.
All statistics are for user that is logged out from WordPress. My website is on LH.pl hosting with SSD drive. Also, as a side note, for this test I disabled everything that I’m using by default to speed website, to make this case study as full as possible. Another thing to consider is that with higher traffic, loading time for a website will increase. So even if 2, 2.5 seconds are not alarming now, with high traffic on server it will increase to few seconds. This case study is to show you, how to use some tools and what you can do to make your website work faster.
Analysis
So lets see what Query Monitor can tell me about homepage for my CORPO005 template.

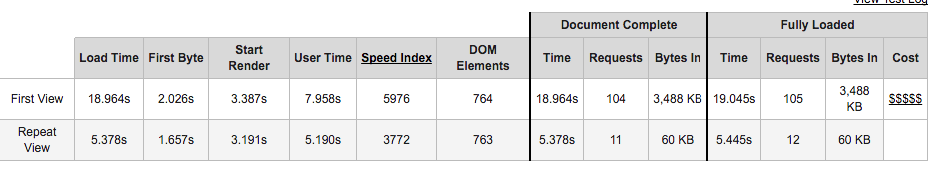
The homepage took 2.42 seconds to load and made 103 database queries. Not terrible, but it should load faster. When I’m analyzing a website, I also check chrome dev tools network tab, and stats from WebPageTest.

Dev tools show 35 requests and 3.6MB. We can do better, but we will get to that. Results from WebPageTest are a bit different when it comes to timing, because we have almost 1.77 for first byte in first view, and almost 1.8 seconds for repeat view. Repeat view is the one that take some resources from cache. For the WebPageTest I chose London, Chrome and Cable (5/1 Mbps 28ms RTT).
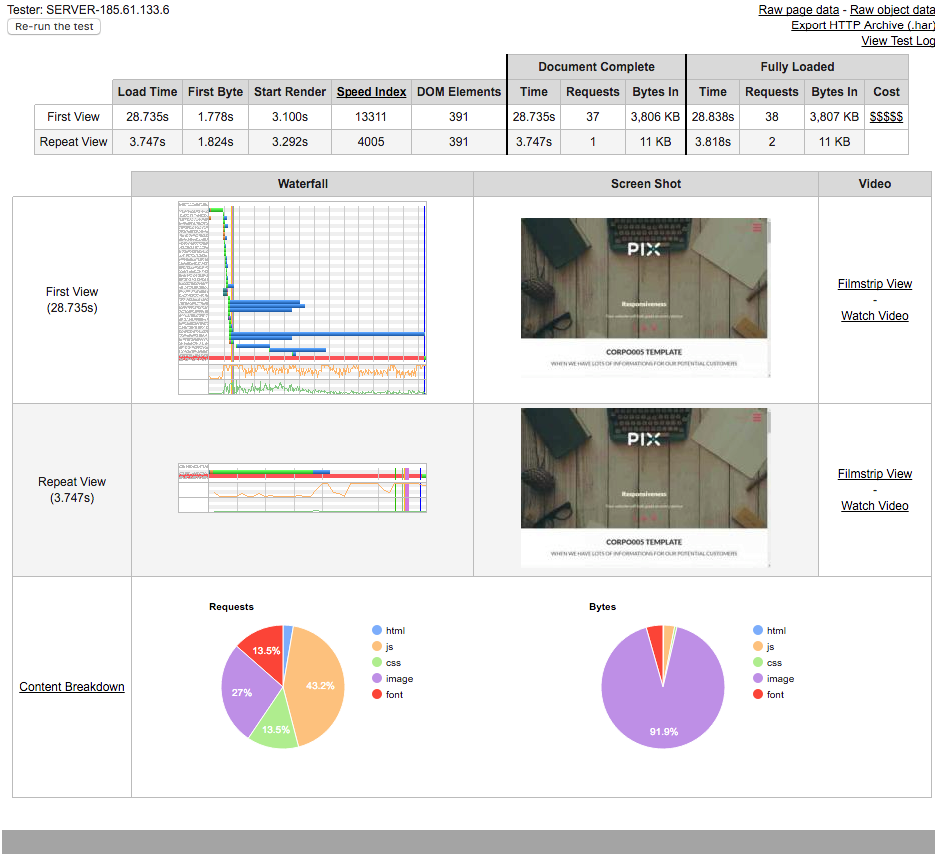
This difference in loading time between my dev tools and webpagetest, is related to network speed and location. Those two should also be considered in relation to performance.
Ok, so lets see quickly how well my subpage “All available sections” is doing.


1.6 seconds and 164 queries, not bad for that many queries. And WebPageTest is showing 2 seconds for first view.
Ok. So lets begin the fun part and start making some performance mojo.
Advanced Custom Fields optimization
Because I use a lot of ACF fields, my first focus will be here. In Query Monitor there is section “Queries by Component” where you can quickly see which component makes the most queries. Based on that maybe you’ll see a way to decrease the amount of queries. This is a breakdown for the subpage:
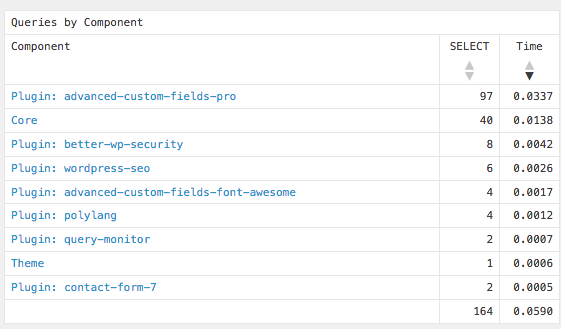
Advanced Custom Fields makes 97 queries! That’s a LOT. Looking at the actual queries you can see some pattern. There are many “triple” queries that look similar to this:
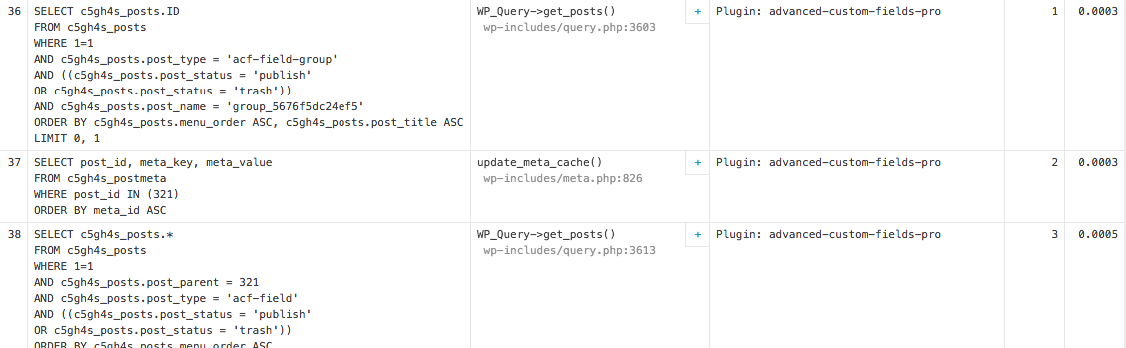
It seems like it’s pulling field structure from database. That’s enough for me to see if there is a way to avoid it. And there is! JSON to the rescue!
ACF JSON
In ACF there is something called “Local JSON“. In documentation you can read: “The idea is similar to caching and both dramatically speeds up ACF”. Well tell me no more!
The only thing you need to do to enable this is:
- create directory “acf-json” inside your theme directory
- re-save all your group fields, by simply clicking “update” in each group
By doing this you will create json files with fields structure and settings. That way you will avoid database queries.
After that, total database queries dropped from 164 to 107! Thats already 57 queries less. Win!
Images in repeater
The other bottleneck when using ACF that we don’t see at first are images inside of repeater fields. This is something not easy to “fix” on working website, but should be considered early in development. Basically the problem is that when you have image field with “Image Array” or “Image URL” as a return value, it will make +1 query for this image. So if you have 10 rows in repeater with image that means +10 queries. If you have more image fields inside, or more rows, that means, you guessed it, more queries ;o)
So the idea here is simple. Set return value to “Image ID”, make a loop before you start using ‘have_rows’ and create an array of all images ID. Make one request get_posts() with “post__in” to select all those images in one query. Something like this:
$cache_images = get_posts(array('post_type' => 'attachment', 'numberposts' => -1, 'post__in' => $images_ids));This will add those images to WP cache, so later when you’ll call wp_get_attachment_image_src() the image will be pulled from cache. No extra query will be made.
Yes, you will have to get url/alt with some extra functions inside your code, but even so, it won’t generate additional queries as it will be pulled from WP cache you just set with get_posts.
Also if you stop using most of the “have_rows” functions and just use repeaters like arrays (because they are in fact arrays), maybe you’ll safe some extra queries along the way. There will be more detailed post about it, when I find some time, but this description should be enough for you to start. It will be worth it. Why? I’ve made such changes in my code. Look at numbers below.
74 total database queries. 0 queries made by ACF. Say, what?
Let me remind you, that I started with 164 queries where 97 of them were from ACF. That’s gold! :o)) Yes 164 – 67 != 74 that I have at the end, but there are some extra queries made by caching images and so on. In general dropping from 164 to 74 queries is really impressive. Are you impressed? I surely am. When I saw this, I knew that all that time I spent on research and rewrite of my code, was really really worth it. Picks or didn’t happened:
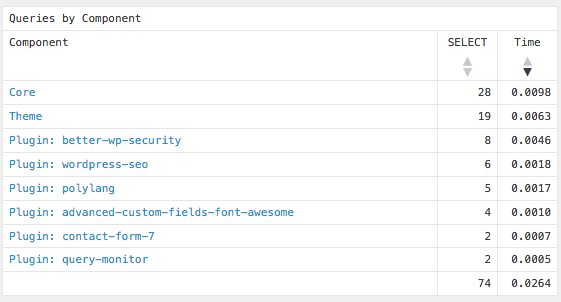
See, no queries from ACF! Ok, so now that ACF is well optimized – I don’t think I can make less than 0 ACF queries, but hey, who knows ;o)) – let see if there is something more I can do with queries.
Multiple get_option queries on each page refresh
Options are important part of WordPress and CMS in general. There’s no doubt about it. But each plugin or theme adds some options to database. Those options will be loaded at some point. If the option is needed on every page refresh it should be autoloaded at the very beginning. For this to happen, this option must have “autoload” set to “yes” in database. If you don’t really feel or understand how and when options are loaded, here is a nice answer on stackexchange.
So let’s go back to Query Monitor. There is a nice breakdown on how many queries each function makes:

You can see there is 16 get_option() queries. Looking at the queries itself, I see that 10 of them are made with each page refresh. Doesn’t matter on which subpage you are. Those queries if they are actually needed globally, should be autoloaded. If they’re not, there are two possibilities:
- Option doesn’t exist in database so it’s not autoloaded (this is the case with jetpack for example)
- Option have autoload = no.
If those options are from your theme, then you can set autoload = yes yourself. If it’s from plugin, then you can either ask plugins author, change yourself in database or just accept that those queries can’t be removed from your total count ;o)
If you change autoload to yes for option from plugin – those can be pointless if the plugin is adding/removing options from database (like iThemes Security). So even if you change it to autoload=yes, once option is removed, this autoload flag will be again set to no. It’s not an issue if it’s few queries. But if you have MANY plugins and several dozens queries like this, then it’s worth looking into it.
Aside: Ok, to be honest, there would be few more queries in all those stats, but I already contacted some plugins authors about this and some might already fixed/do something about it before I wrote this post.
Combine and minify JavaScript and CSS
Next step in speeding up a website will be looking at the resources. In the chrome dev tools you can filter resources to see how many JS/CSS/fonts and so on you have.
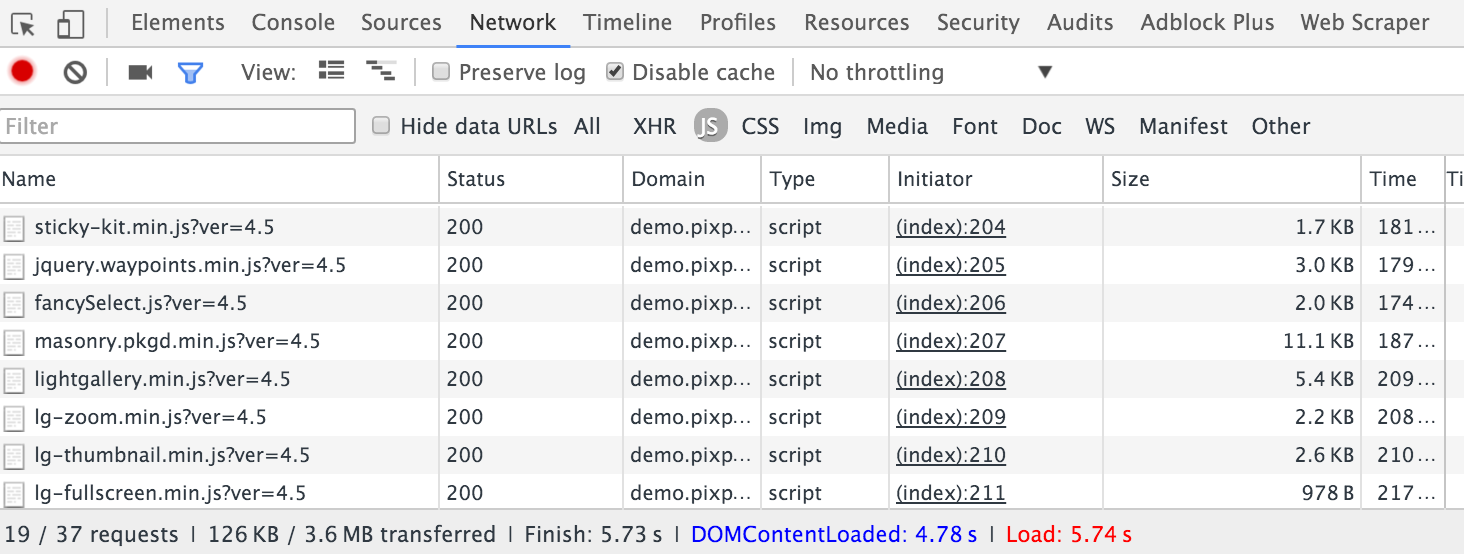
So. On my homepage I have 37 resources in total. Breakdown looks like this: 19 – JS, 6 – CSS, 10 – images, 1 – font, 1 – doc. Is there a way to decrease this number? Well, doh!
This are basics of optimization. Combine and minify your resources (and gzip them if you can). Yes, this is a pain if you don’t automate it, but if you use wp_enqueue_scripts() this is fairly easy with a plugin. For this I use Better WordPress Minify. After installing this plugin, the total number of resources dropped to 21.
Optimize images
It doesn’t matter if you decrease number of resources or queries, if your resources are really heavy. Like images for example. We do use them a lot on websites, so it’s important to optimize it. Of course you don’t do it at the beginning, because you upload images, see if they fit. Or simply client is doing it, and usually client doesn’t care or know there is a size/weight to consider.
So on my homepage it looks like I have one huge image that weight 1.4 MB. How this happened? Well simply we were looking for perfect image and forgot to decrease size after. Which isn’t that uncommon.
This is a bit out of case study, but just recently we had a client that loves photos. We made this “mistake” and introduce unsplash. Which is btw awesome resource for free photos in high resolution. But! It’s in high resolution. Often with more than 4000px. We don’t need such resolutions for websites. So how we can avoid it? Imsanity to the rescue. This plugin simply resizes huge image on uploads. But that’s just a precaution and doesn’t compress images.
Compressing images with some optimization tool is like magic. I don’t have a plugin that will help with that, but I do have native app. ImageOptim. I LOVE IT. I usually download uploads folder when we are done, run through this app and upload it again. With smaller image sizes. This will also optimize all thumbnails created by WordPress. And this is how it looks after:
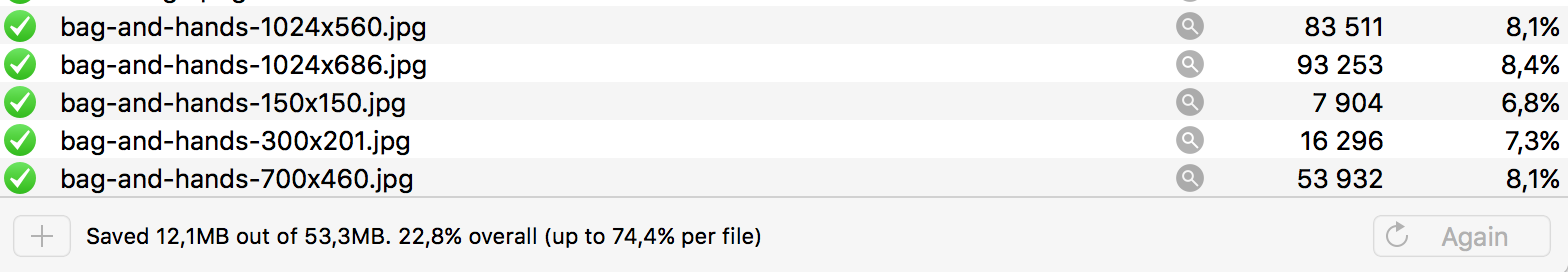
Saved 12,1MB out of 53,3MB. The result of this optimization?
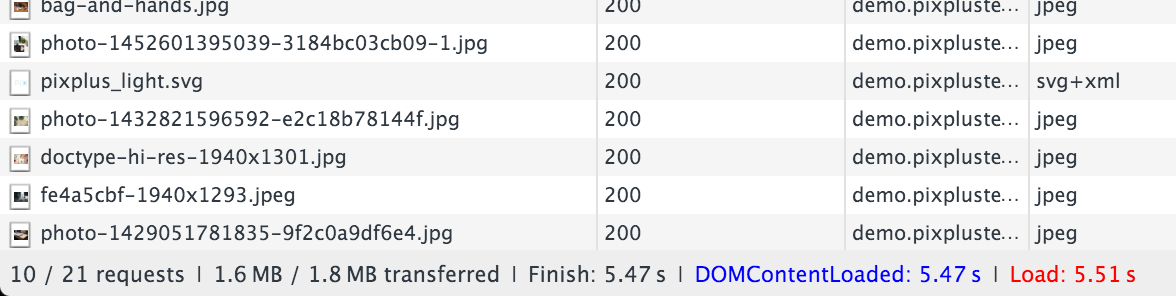
We started with 3.6 MB of total homepage weight, and now it’s 1.8 MB. Yay!
Switch to PHP7
PHP7 it will be a new buzzword for 2016. I’m sure of it. Just like HTML5 and CSS3 was few years back. Yes, it was already “few years back”. Time flies… Anyway, PHP7 have the power. So if PHP7 is available on your server, and your plugins in WordPress are up to date, and don’t need some php4 to work, you should switch to PHP7. There is a great post PHP 7: 10 Things You Need to Know you should read to know more. There are some stats on how many users PHP7 can handle comparing to the old php 5.x. They wrote “don’t use it in production” but it was wrote in November 2015, so a lot happened since then.
The results
There is of course more to do, like turning on gzip, adding expire headers and so on, but those are covered by many other articles. I don’t want to reapeat all other basics here. So for optimizations that I’ve done here, let the numbers speak for themselves.
Homepage
Before optimization: 103 database queries | 2.42 s load | 37 requests | 3.6 MB
After optimization: 47 database queries | 0.9 s load | 21 requests | 1.8 MB
All available section subpage
Before optimization:164 database queries | 1.6s load | 102 requests | 3.2 MB
After optimization: 74 database queries | 0.78 s load | 92 requests | 2.6 MB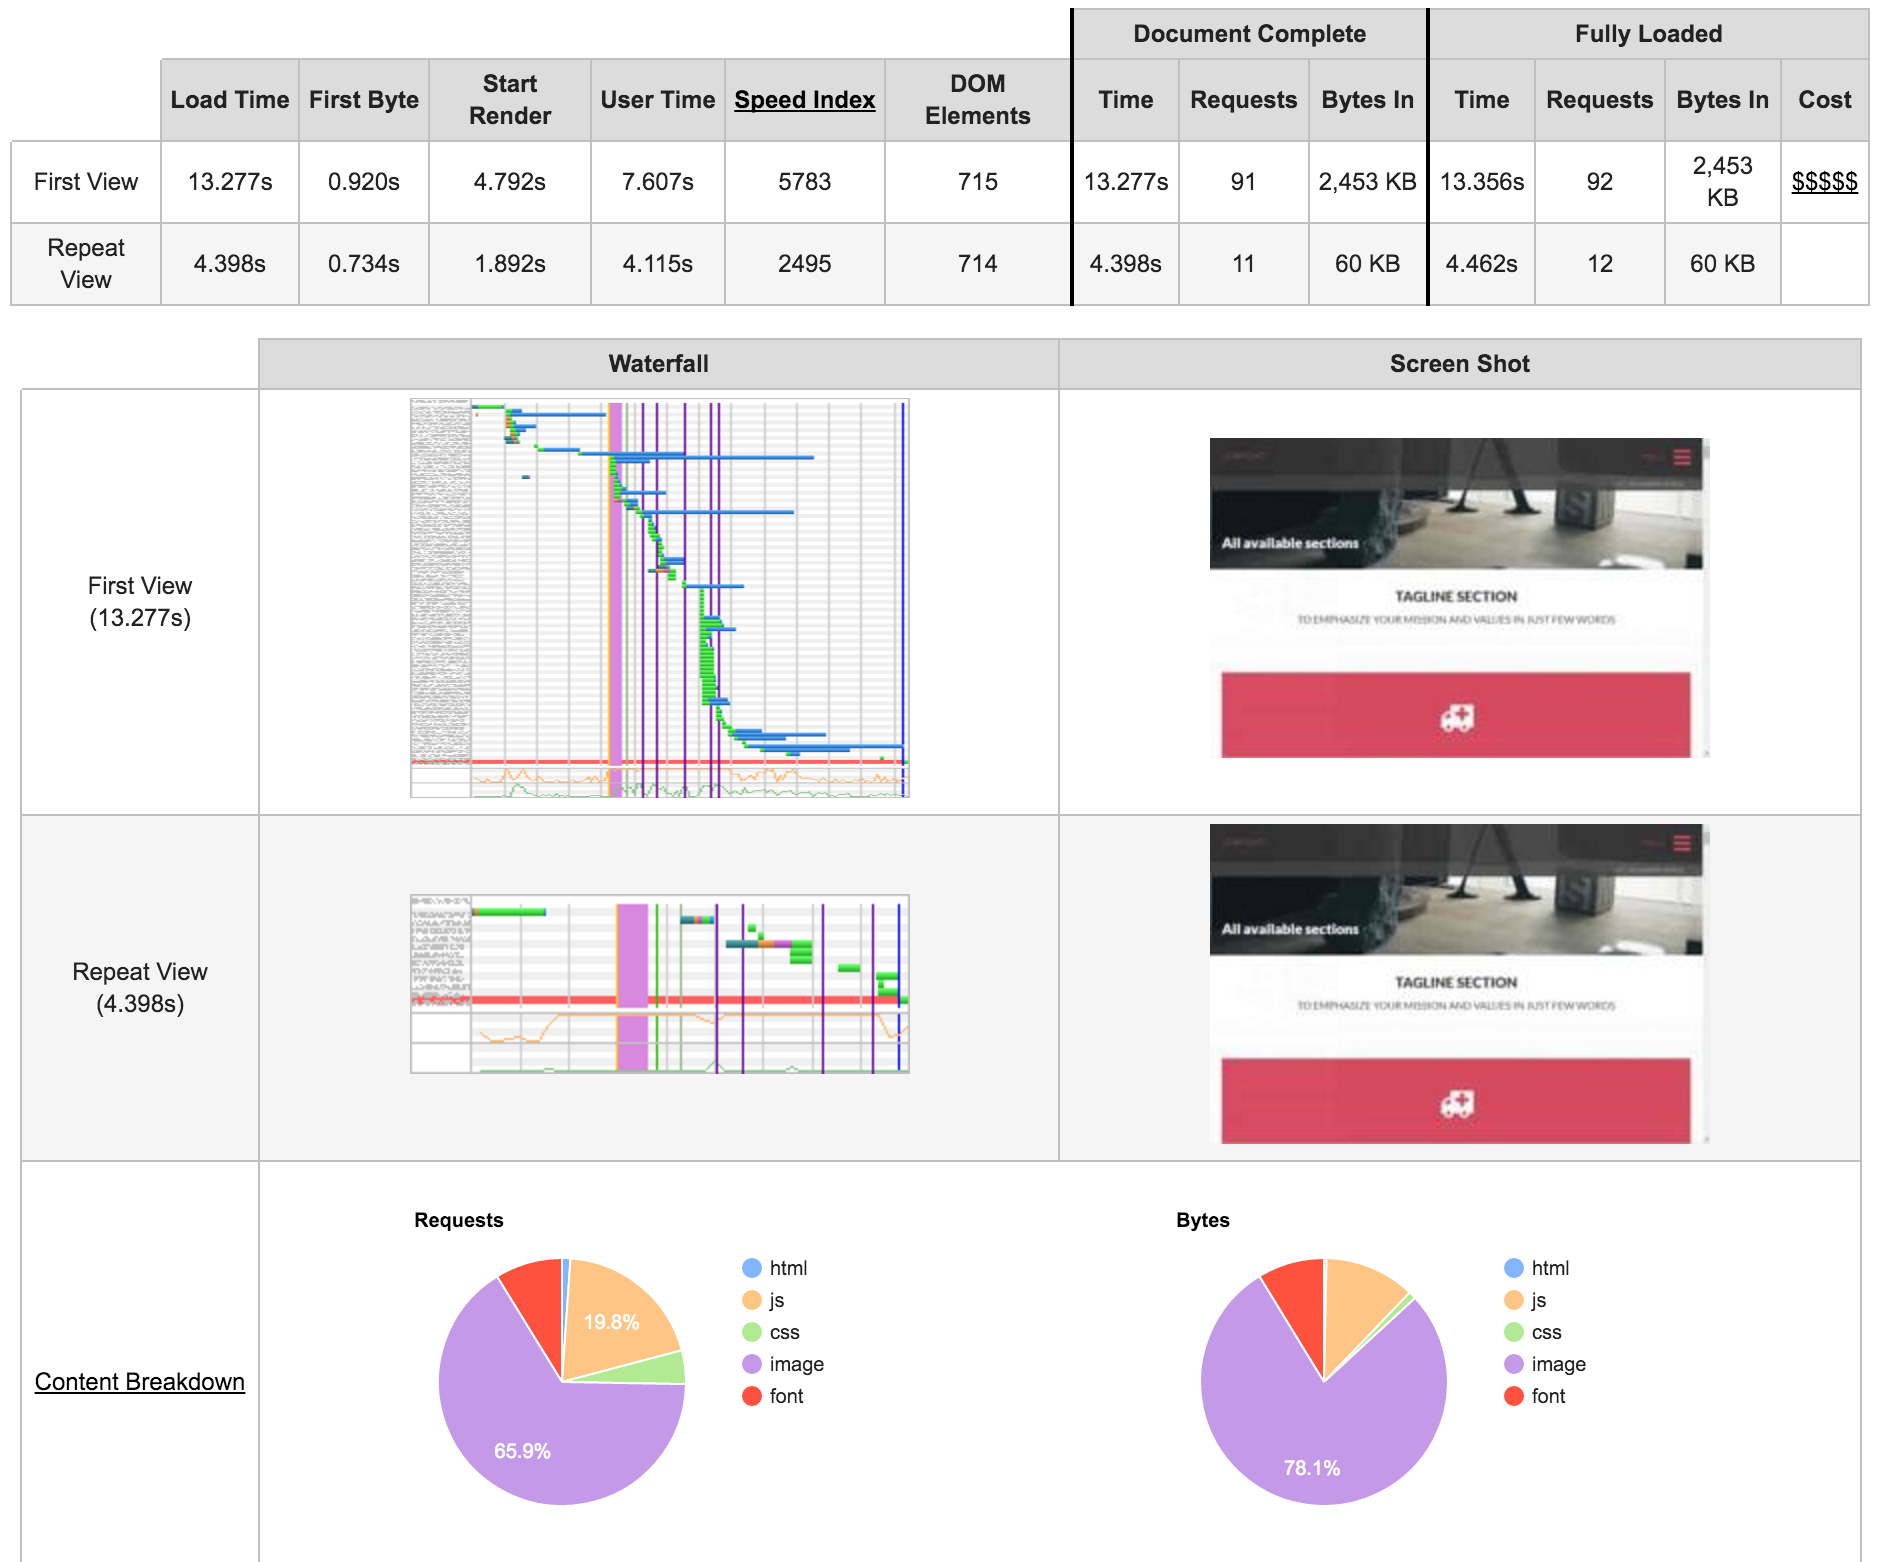
You might think that optimization isn’t important, until you get high traffic that basically cause your website to stop working. All tests/stats you see here are for website with low traffic (if any). For me every ms counts and some might say it’s not worth it. But it is. Most sites currently are responsive. And the important part of it, is to make website as fast as possible. So every second, every byte counts.
If you have any other ideas or question just leave a comment. Happy optimizing! :o)
Eliza, hats off to you!
I use flexible content to create page builders for my clients, most of them have 10 groups and 20+ repeater fields.
By enabling ACF JSON, saving a page in wordpress speeded up things considerably. From 12-15 seconds down to 2.
Thank you!
My issue here is that I am now in charge of a project whereas the entire website is built with custom fields. Looks like I will need to do a lot of theme file customization in order to add content to each page in order to build page authority. Is that right?
Yes, unfortunately you need to refactor the code.
Wow thanks a lot !! its great to see how to optimize all these !
We have so many AFC fields that the loading time is a 94% of total loading time so you guess this will be quite nice to do for us !
I am glad that i have found this article! and thanks to you !
Such an interesting article, I can’t believe i’ve not run across this information elsewhere. It’s all too easy to stick ACF fields all over our sites to help client without thinking about the optimisation. That local JSON tip is a god send!
Great article with lots of great techniques, and just wanted to contribute something to it. For image compression there is a web tool called tinypng. Its really awesome and i stopped using anything else after i found it. They also have a wordpress plugin now called “Compress JPEG & PNG images”, work wonders.
Nice tip.
Thank you for this post. I’ve been trying to solve some performance issues and this post was gold.
And yes – dropping from 164 to 74 queries is really impressive. I was impressed – even before you asked. lol
Wow, what a great post about ACF! I work with this plugin everyday and I didn’t knew that something like Local JSON exists. Thank you Eliza!
This is a great post on ACF performance optimization – it’s taken me a long time, but i’ve been a real stickler for performance when I do theme development because the pay-off is worth it. So thank you for your write-up. A few things that have worked really well for me, is using Gulp to do the minification / combining in a build process, combined with JSlint I can usually spot any early conflicts and it all gets crunched into one request for JS and one for CSS (here I use a Foundation 6 framework). For image compression – there… Read more »
Thansk for sharing